Monitoring and Logging for Cloud Functions
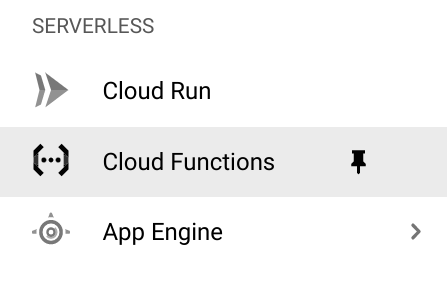
- In the Cloud Console, select Navigation menu > Cloud Functions, and then CREATE FUNCTION.

- Set the following:
Function Name: helloWorld
Trigger type: HTTP
Authentication: check the box next to Allow unauthenticated invocations
Click SAVE. - Expand Runtime, build, connections and security settings. Under Autoscaling, set the Maximum number of instances to 5. Click NEXT.
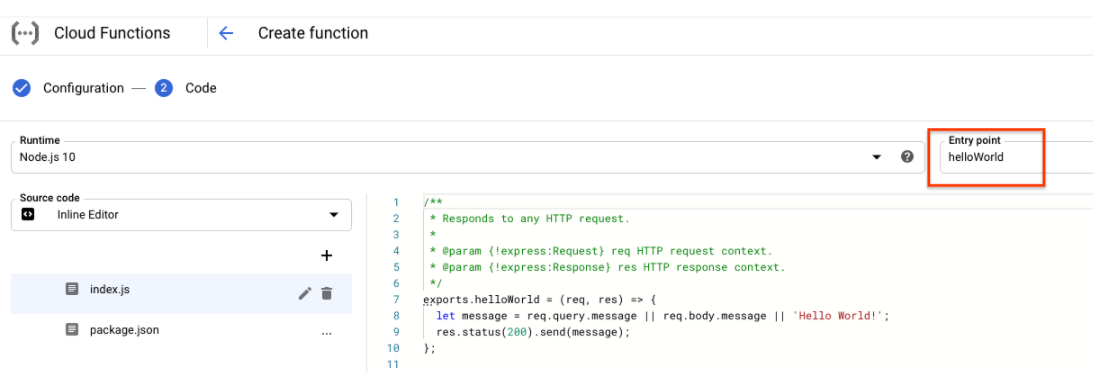
- You will see the following:

- Click DEPLOY.
- In Cloud Shell, run the following to get a tool called vegeta that will let you send some test traffic to your cloud function:
curl -LO 'https://github.com/tsenart/vegeta/releases/download/v6.3.0/vegeta-v6.3.0-linux-386.tar.gz'
- Unpack the vegeta tool by running the following:
tar xvzf vegeta-v6.3.0-linux-386.tar.gz
- Still in the Cloud Functions page, click the name of your function, and then click on the
Triggertab. Click the Trigger URL for your function. - Now send traffic to your cloud function. Run the following in Cloud Shell, replacing
<YOUR_PROJECT_ID>with your Project ID.echo "GET https://us-central1-<YOUR_PROJECT_ID>.cloudfunctions.net/helloWorld" | ./vegeta attack -duration=300s > results.bin
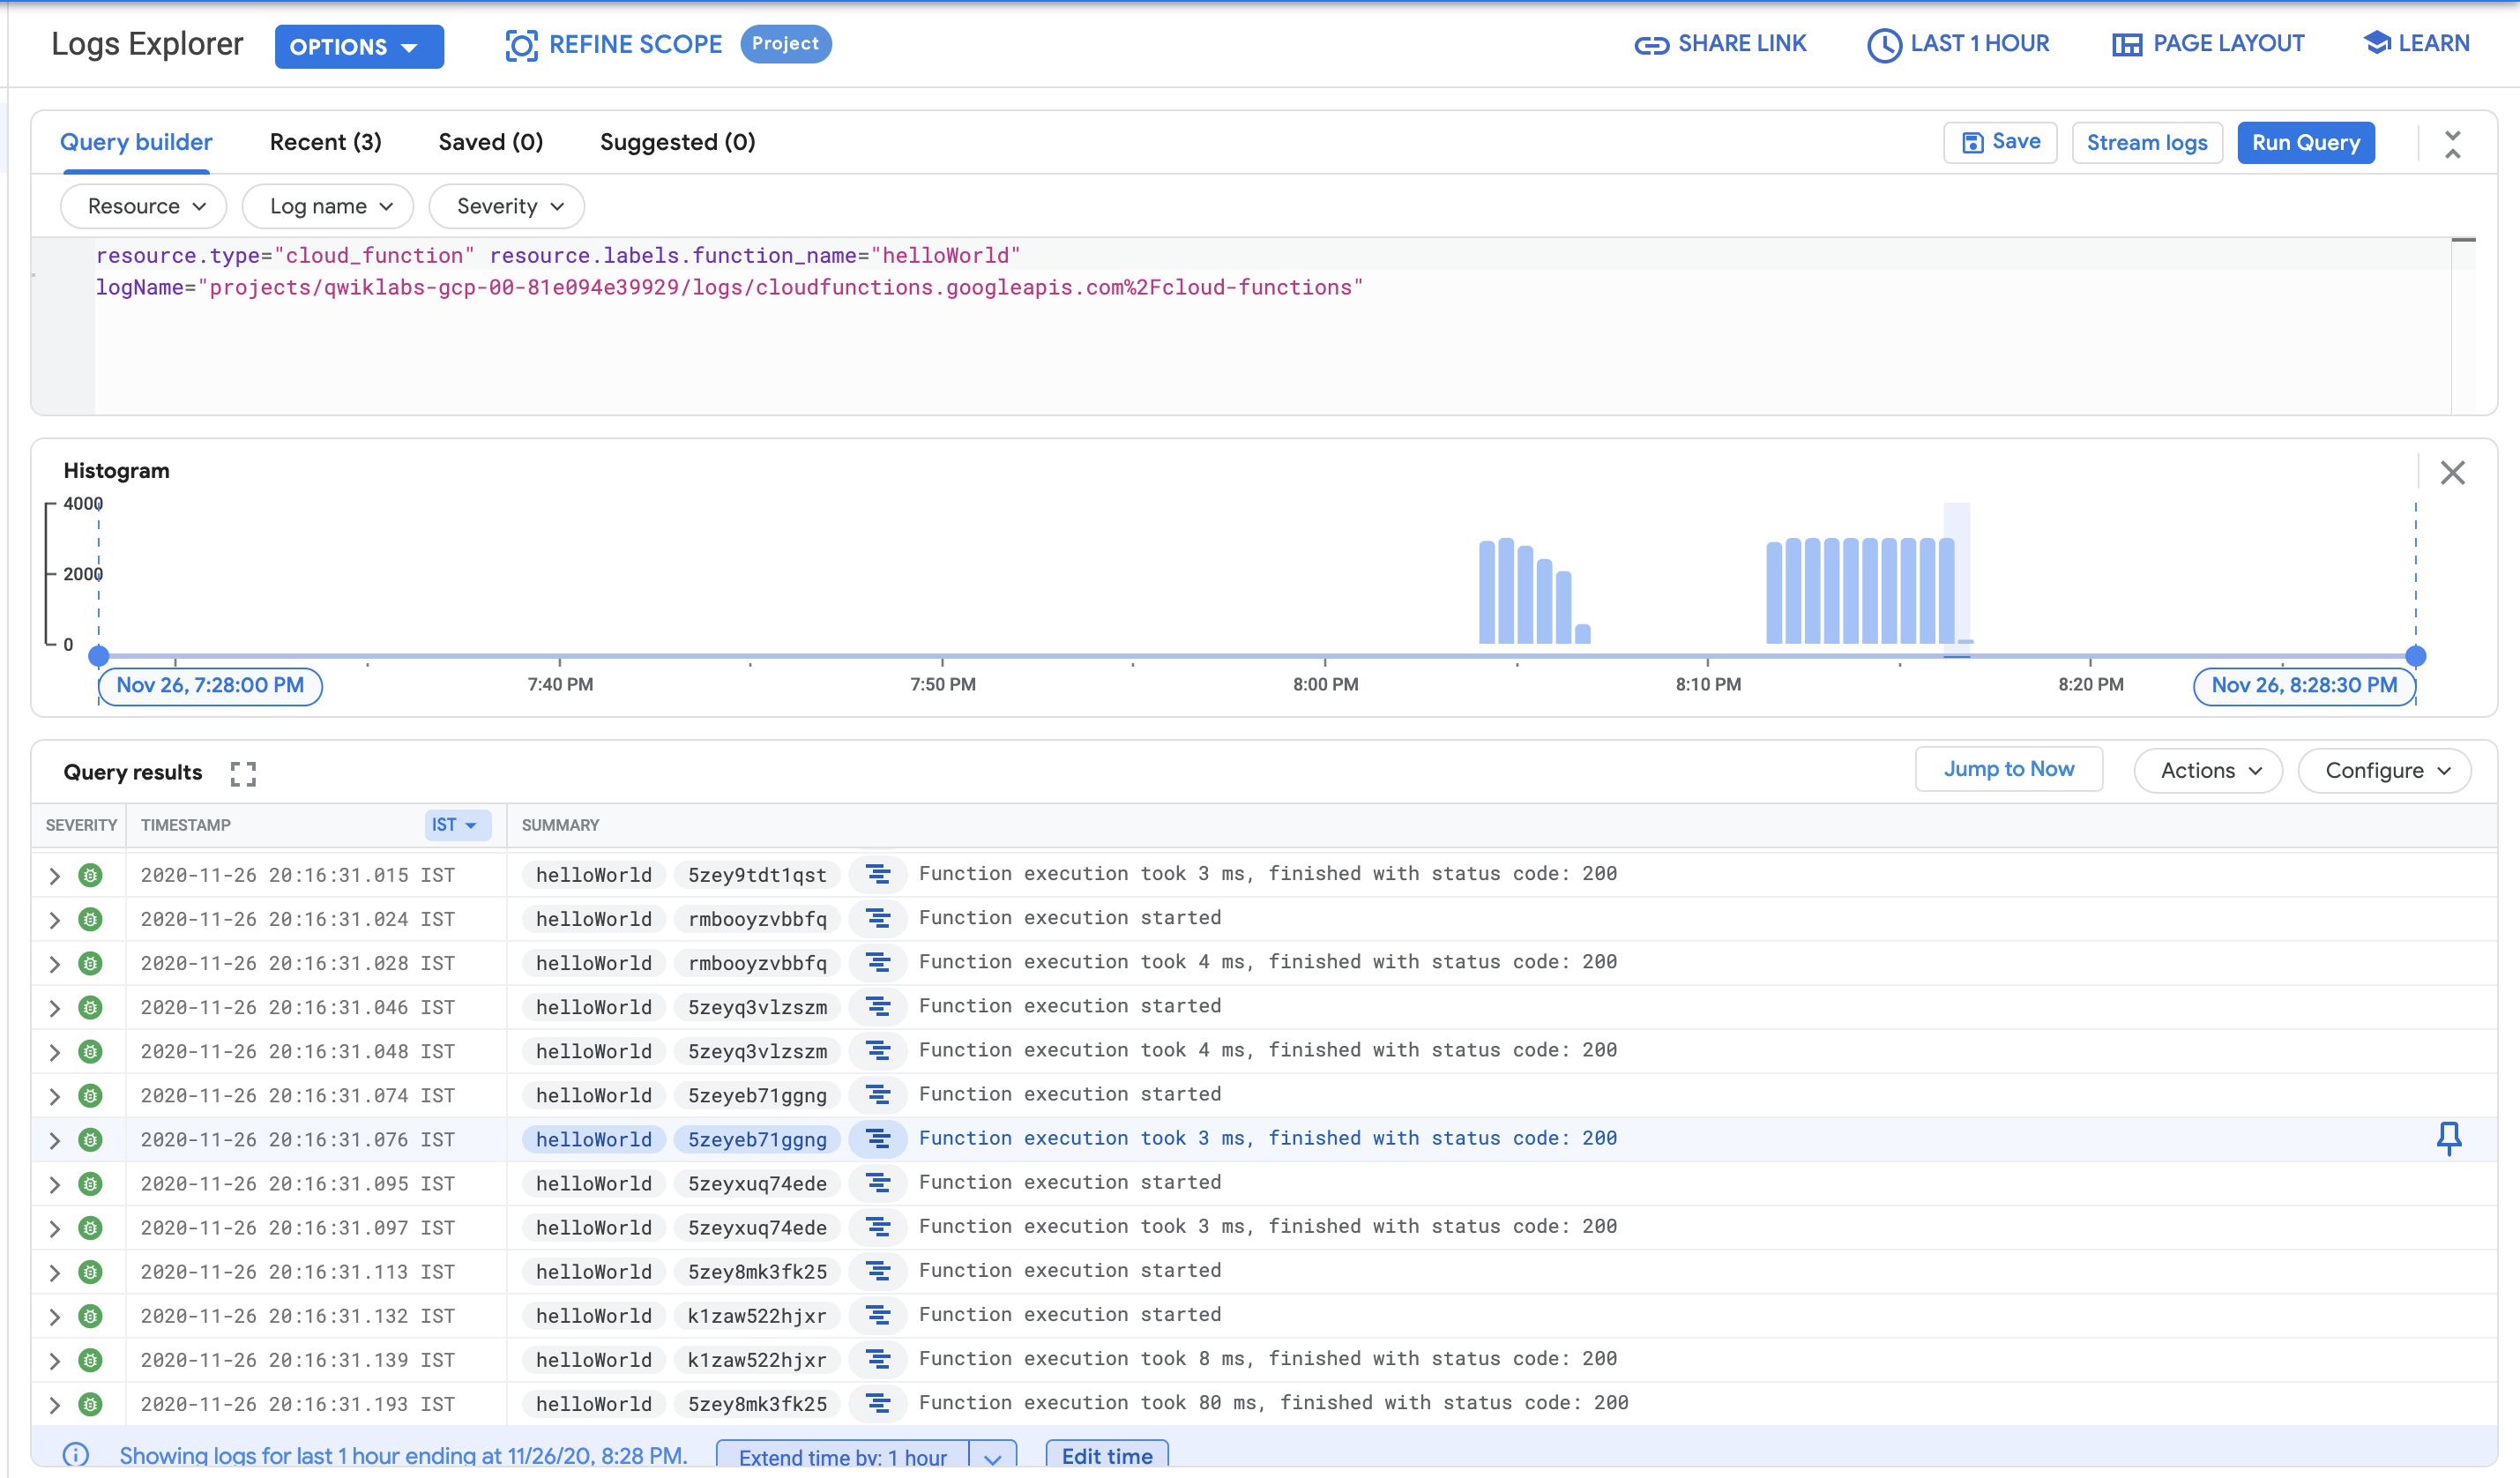
- In the Console, select Navigation menu > Logging > Logs Explorer. The Cloud Logging opens in the Console.
- To look at just the logs from your Cloud Function, in the Resource dropdown, select Cloud Function > helloWorld then click Add. In the Log name dropdown, select cloud-functions checkbox then click Add.
Click Run query.

- Click Create metric.
- In the Create logs metric:
Change the Metric Type to Distribution.
Name your metric CloudFunctionLatency-Logs.
Enter textPayload for Field name.
Enter the following in the Regular Expression field.execution took (\d+)
- Click CREATE METRIC.
- In the Cloud Console, click Navigation menu > Monitoring.
- When the Monitoring Overview page opens, your metrics scope project is ready.
- In the left menu, click Metrics explorer.
- Start typing
executionsinto the Select a Metric dropdown, and then select Cloud Function > Function > Executions from the suggested metrics and click Apply. - Change the graph type to Stacked bar chart using the dropdown menu above the graph.
- Explore other graph options, try a different metric. For example, click your current CLOUD FUNCTION – EXECUTIONS metric to open the dropdown, select Execution times, and change the graph type to Heatmap chart.
- Continue to explore and experiment. For example, go back to the Executions metric and change the aggregator to the 95th percentile. Select the graph type Line.
- In the left menu, click Dashboard.
- Click on + CREATE DASHBOARD.
- Click on + ADD CHART.
- In dropdown menu, select Stacked bar
- In the Resource & Metric section, select the default VM INSTANCE – CPU UTILIZATION metric to open the dropdown and change the metric.
- Start typing
executionsinto the Select a Metric dropdown, and then select Cloud Function > Function > Executions from the suggested metrics and click Apply. - After you create the first chart, click + ADD CHART > Heatmap to create the next one.
- In the Resource & Metric section, select the default VM INSTANCE – RTT LATENCIES metric to open the dropdown and change the metric.
- Start typing
execution timesinto the Select a Metric dropdown, and then select Cloud Function > Function > Execution times from the suggested metrics and click Apply.
Tag:Google Cloud


