Getting Started with Cloud Monitoring
Create a Compute Engine instance
- In the Cloud Console dashboard, go to Navigation menu > Compute Engine > VM instances, then click Create instance.
- Fill in the fields as follows, leaving all other fields at the default value:
Name: lamp-1-vm
Region: us-west1
Zone: us-west1-b
Series: N1
Machine type: n1-standard-2
Boot disk: Debian
Firewall: Allow HTTP traffic - Click Create.
Add Apache2 HTTP Server & Ops Agent on your instance
- In the Console, click SSH to open a terminal to your instance.
- Run the following commands in the SSH window to set up Apache2 HTTP Server:
sudo apt-get update -y
sudo apt-get install apache2 php7.0 -y
sudo service apache2 restart
- Run the Monitoring agent install script command in the SSH terminal of your VM instance to install the Cloud Monitoring agent.
curl -sSO https://dl.google.com/cloudagents/add-google-cloud-ops-agent-repo.sh
sudo bash add-google-cloud-ops-agent-repo.sh --also-install
sudo systemctl status google-cloud-ops-agent"*"
Create an uptime check
- n the Cloud Console, click Navigation menu > Monitoring.
- In the Cloud Console, in the left menu, click Uptime checks, and then click +Create Uptime Check.

- Set the following fields:
Title: Lamp Uptime Check, then click Next.
Protocol: HTTP
Resource Type: Instance
Applies to: Single, lamp-1-vm
Path: leave at default
Check Frequency: 1 min - Click on Next to leave the other details to default and click Test to verify that your uptime check can connect to the resource.
- When you see a green check mark everything can connect. Click Create.
Create an alerting policy
- In the left menu, click Alerting, and then click +Create Policy.
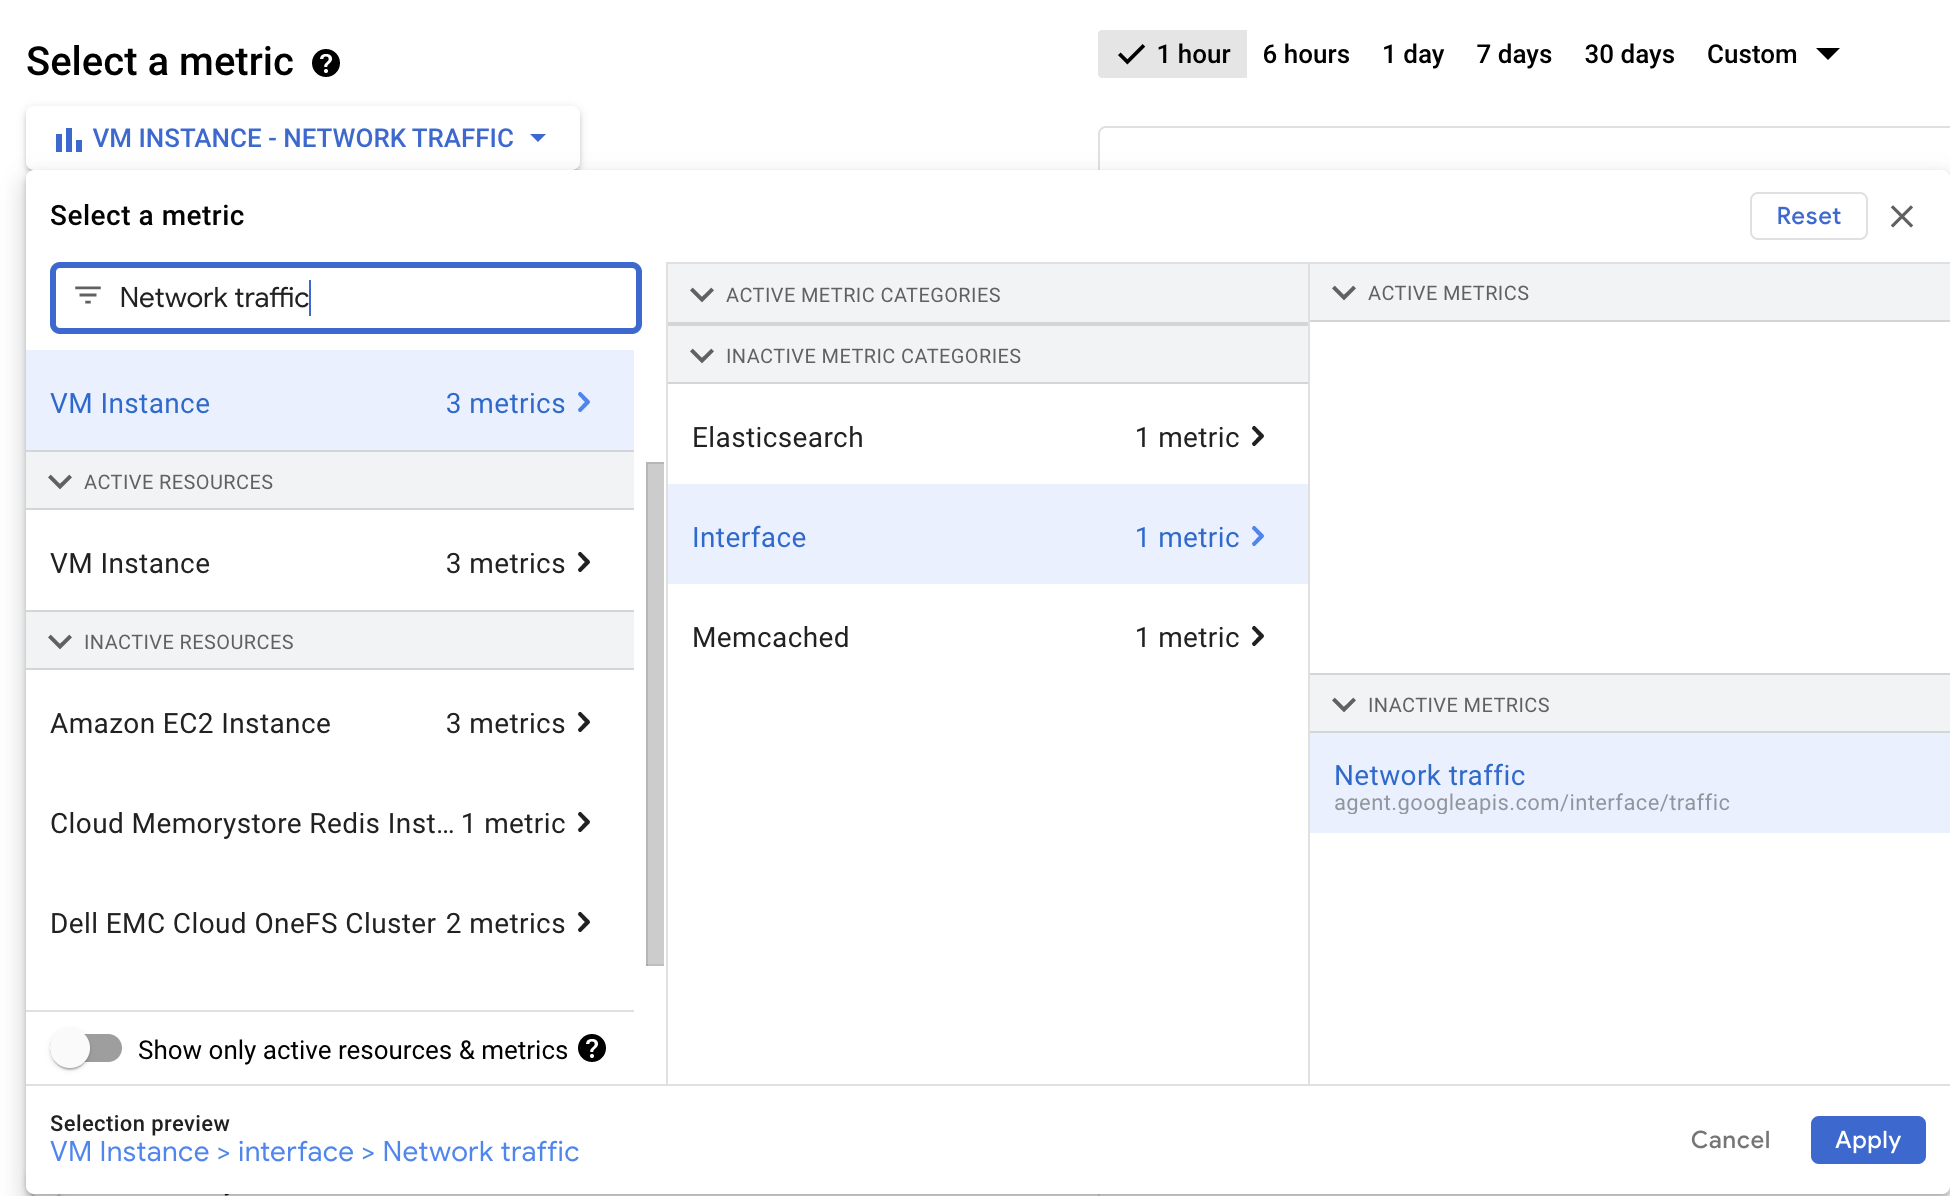
- Click on Select a metric dropdown. Disable the Show only active resources & metrics.
- Type Network traffic in filter by resource and metric name and click on VM instance > interface. Select
Network traffic(agent.googleapis.com/interface/traffic) and click Apply. Leave all other fields at the default value.

- Click Next.
- Set the Threshold position to
Above threshold, Threshold value to500and Advanced Options > Retest window to1 min. Click Next. - Click on drop down arrow next to Notification Channels, then click on Manage Notification Channels.
A Notification channels page will open in new tab.
- In Create Email Channel dialog box, enter your personal email address in the Email Address field and a Display name. Click on Save.
- Go back to the previous Create alerting policy tab.
- Click on Notification Channels again, then click on the Refresh icon to get the display name you mentioned in the previous step.
- Click on Notification Channels again if necessary, select your Display name and click OK.
- Add a message in documentation, which will be included in the emailed alert.
- Mention the Alert name as
Inbound Traffic Alert. Click Next. - Review the alert and click Create Policy.
Create a dashboard and chart
- In the left menu select Dashboards, and then +Create Dashboard.
- Name the dashboard
Cloud Monitoring LAMP Qwik Start Dashboard. - Click Line option in Chart library.
- Name the chart title CPU Load.
- Click on Resource & Metric dropdown. Disable the Show only active resources & metrics.
- Type CPU load (1m) in filter by resource and metric name and click on VM instance > Cpu. Select
CPU load (1m)and click Apply. Leave all other fields at the default value. Refresh the tab to view the graph. - Click + Add Chart and select Line option in Chart library.
- Name this chart Received Packets.
- Click on Resource & Metric dropdown. Disable the Show only active resources & metrics.
- Type Received packets in filter by resource and metric name and click on VM instance > Instance. Select
Received packetsand click Apply. Refresh the tab to view the graph. - Leave the other fields at their default values. You see the chart data.

Check the uptime check results and triggered alerts
- In the Cloud Logging window, select Navigation menu > Monitoring > Uptime checks. This view provides a list of all active uptime checks, and the status of each in different locations.
- Click the name of the uptime check,
Lamp Uptime Check. - In the left menu, click Alerting.
- You see incidents and events listed in the Alerting window.
- Check your email account. You should see Cloud Monitoring Alerts
Tag:Google Cloud
