Monitor Azure resources with Azure Monitor
Menu options
You can access Azure Monitor features from the Monitor menu in the Azure portal. You can also access Azure Monitor features directly from the menu for different Azure services. Different Azure services might have slightly different experiences, but they share a common set of monitoring options in the Azure portal. These menu items include Overview and Activity log and multiple options in the Monitoring section of the menu.


Overview page
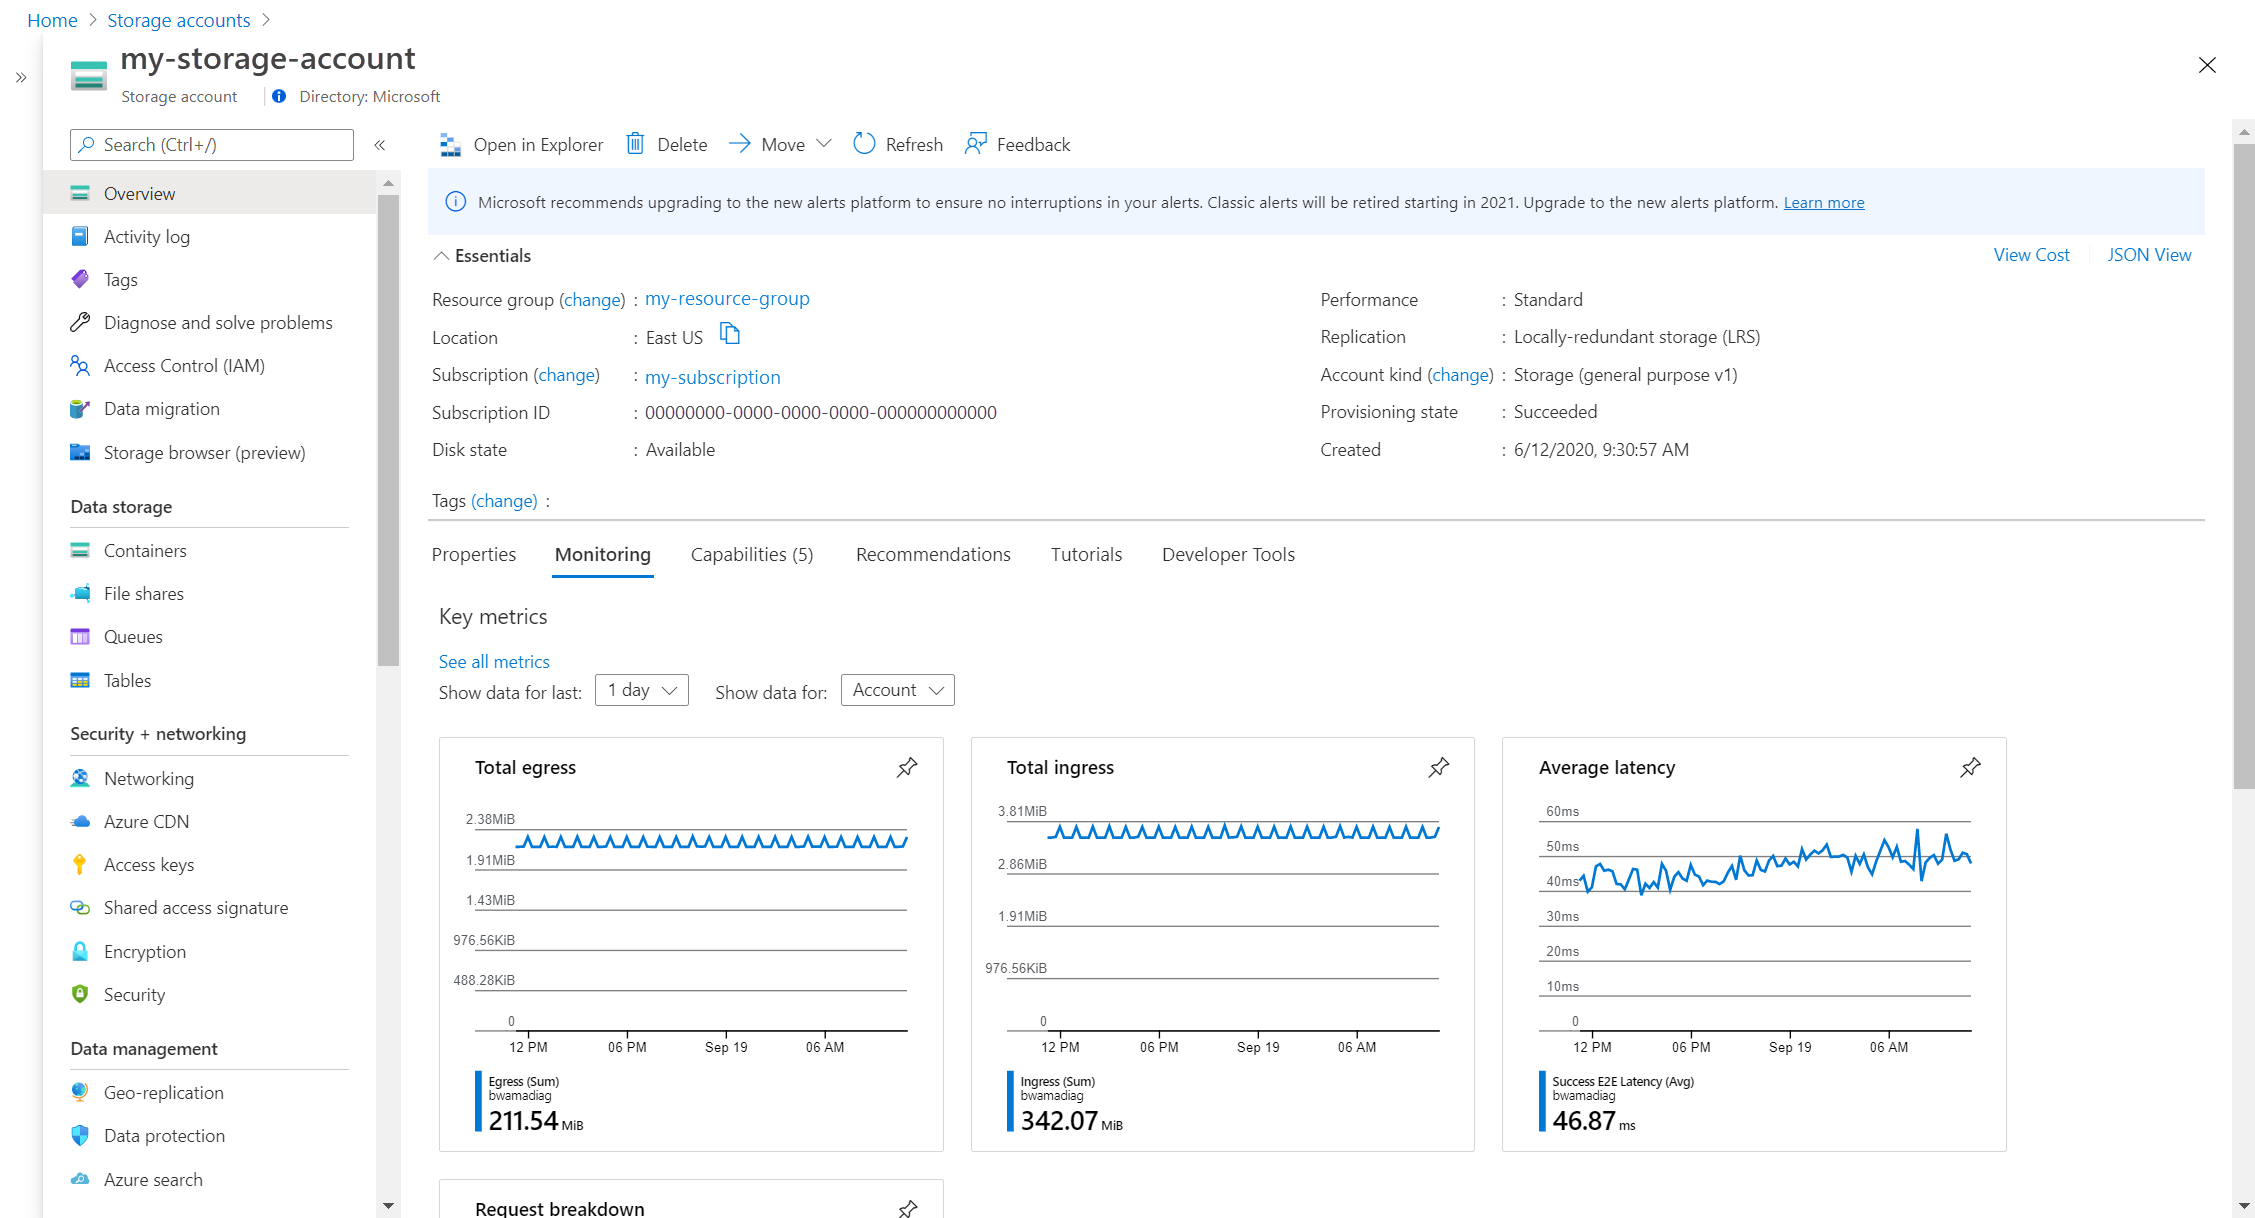
The Overview page includes details about the resource and often its current state. For example, a virtual machine shows its current running state. Many Azure services have a Monitoring tab that includes charts for a set of key metrics. Charts are a quick way to view the operation of the resource. You can select any of the charts to open them in Metrics Explorer for more detailed analysis.

Activity log
The Activity log menu item lets you view entries in the activity log for the current resource.

Alerts
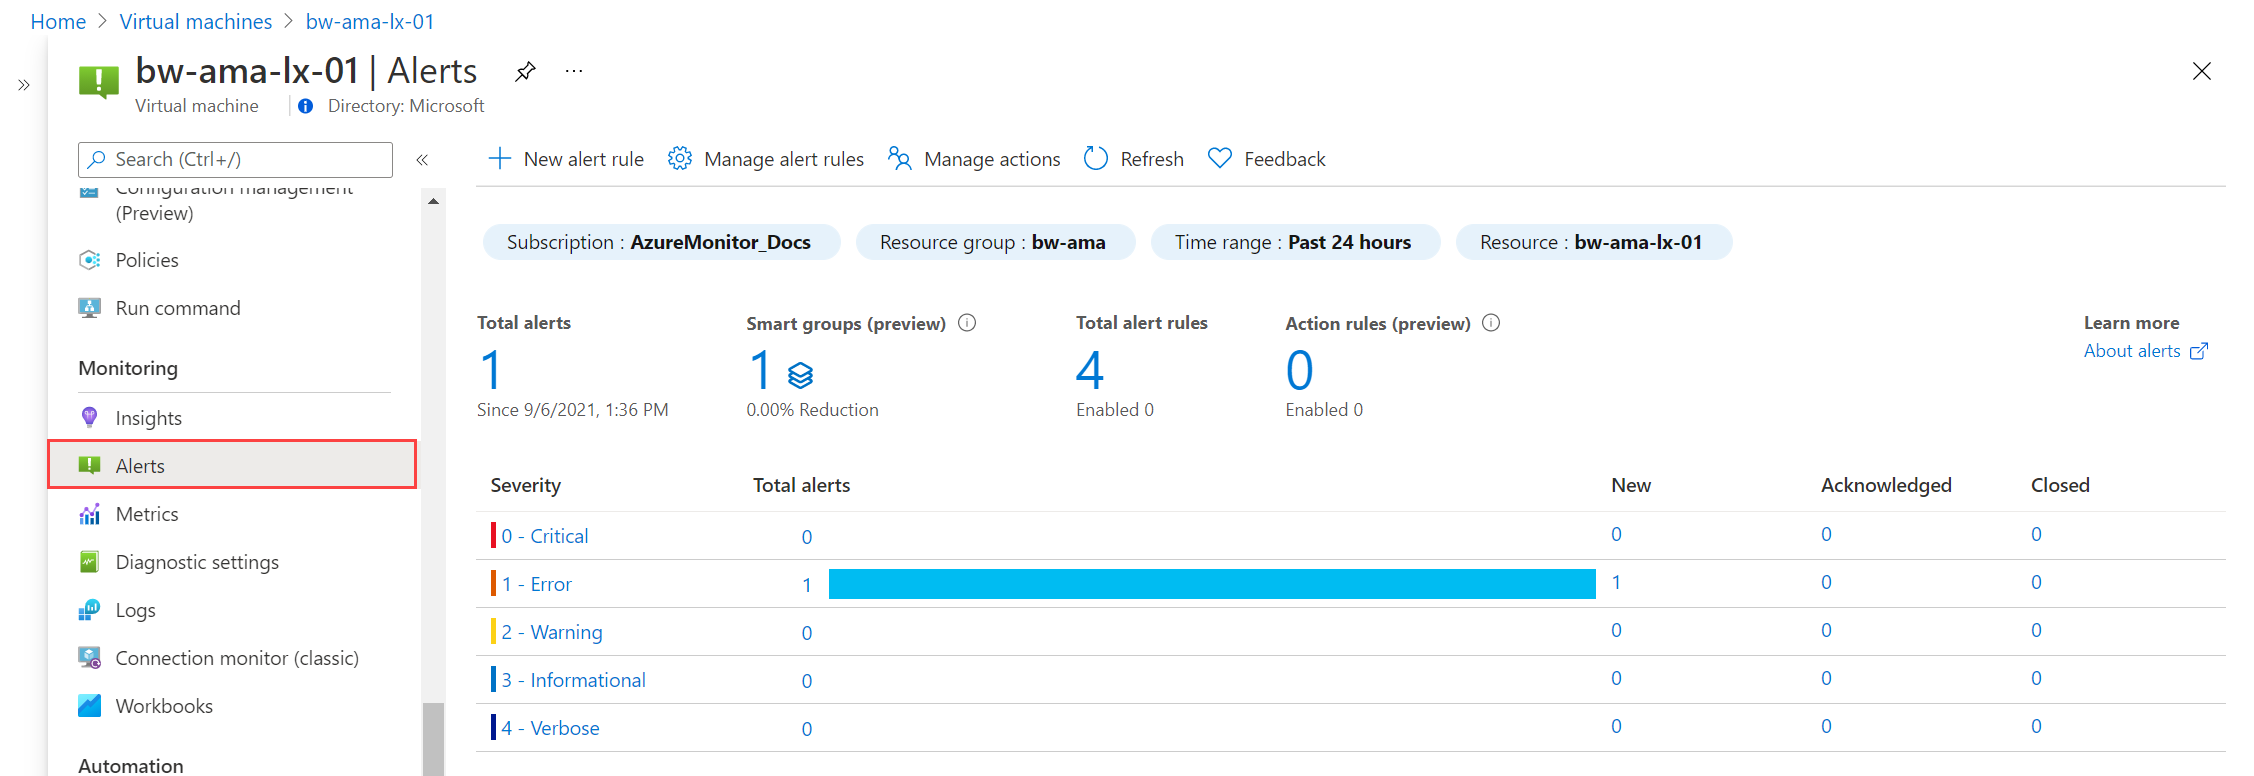
The Alerts page shows you any recent alerts that were fired for the resource. Alerts proactively notify you when important conditions are found in your monitoring data and can use data from either Metrics or Logs.

Metrics
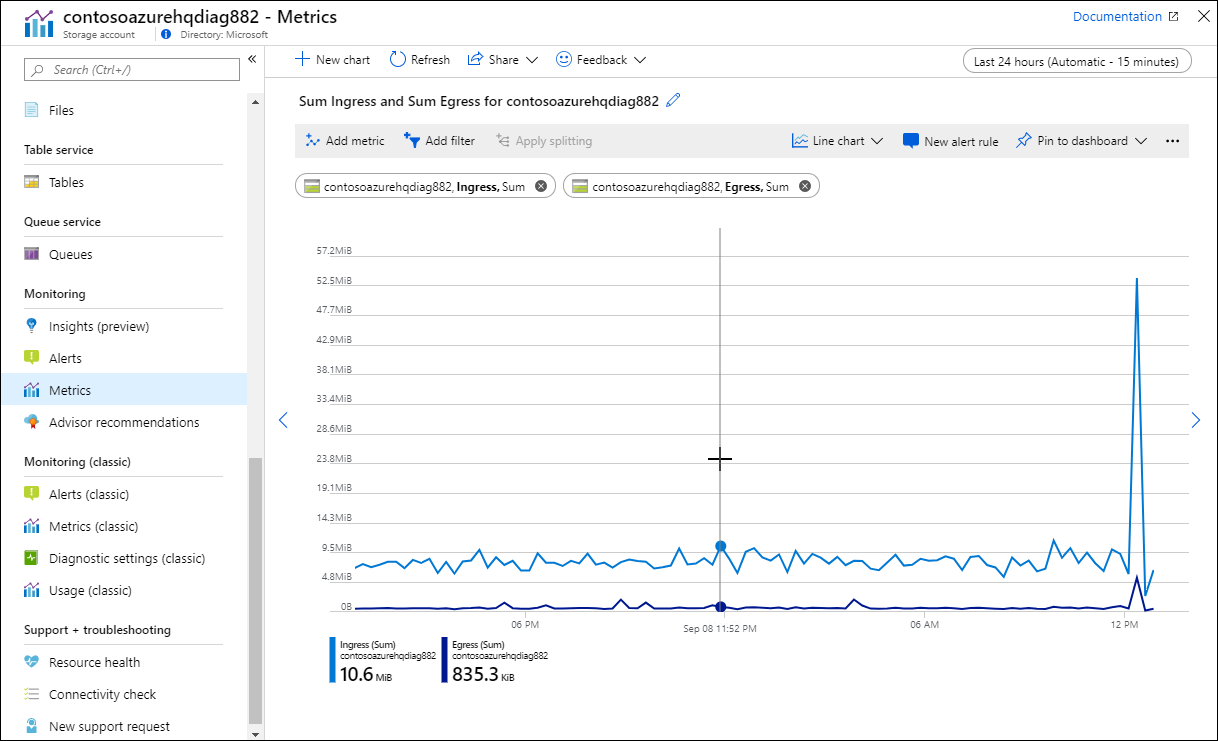
The Metrics menu item opens Metrics Explorer. You can use it to work with individual metrics or combine multiple metrics to identify correlations and trends. This is the same Metrics Explorer that opens when you select one of the charts on the Overview page.

Diagnostic settings
The Diagnostic settings page lets you create a diagnostic setting to collect the resource logs for your resource. You can send them to multiple locations, but the most common use is to send them to a Log Analytics workspace so you can analyze them with Log Analytics.

Insights
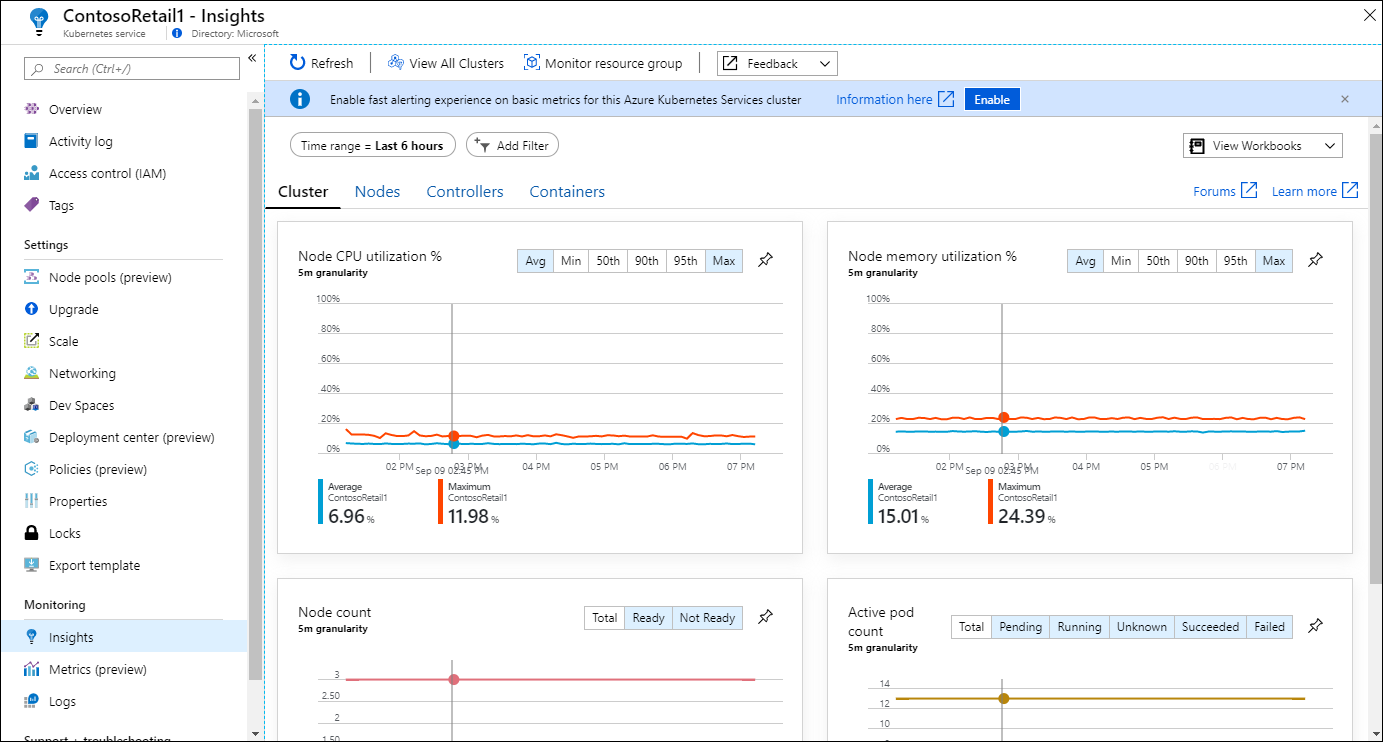
The Insights menu item opens the insight for the resource if the Azure service has one. Insights provide a customized monitoring experience built on the Azure Monitor data platform and standard features.

Tag:Azure
