Reporting Application Metrics into Cloud Monitoring
Create a Compute Engine instance
In the Cloud Console, select Navigation menu > Compute Engine > VM instances, then click Create Instance.
Set the following fields:
- Name: my-opencensus-demo
- Region: us-west1 (Iowa)
- Zone: us-west1-b
- Series: N1
- Machine type: n1-standard-1 (1vCPU, 3.75 GB memory)
- Boot disk: Click Change. Select version Debian GNU/Linux 10 (buster) for Debian OS and click Select.
- Identity and API access: Select Set access for each API, then for Stackdriver Monitoring API select Full from the dropdown menu.
- Firewall: Select both Allow HTTP traffic and Allow HTTPS traffic.
Leave the rest of the fields at their default values and click Create.
Install Go and OpenCensus on your instance
You will use the SSH terminal to install the following:
- Go
- the git package
- the OpenCensus package
- the Cloud Monitoring OpenCensus exporter
Execute the following commands in the SSH terminal:
sudo curl -O https://storage.googleapis.com/golang/go1.16.2.linux-amd64.tar.gz
sudo tar -xvf go1.16.2.linux-amd64.tar.gz
sudo rm -rf /usr/local/go
sudo mv go /usr/local
sudo apt-get update -y
sudo apt-get install git -y
export PATH=$PATH:/usr/local/go/bin
go get go.opencensus.io
go get contrib.go.opencensus.io/exporter/stackdriver
go mod init test3
go mod tidy
curl -sSO https://dl.google.com/cloudagents/add-google-cloud-ops-agent-repo.sh
sudo bash add-google-cloud-ops-agent-repo.sh --also-install
sudo apt-get update
Create a basic application server in Go
- In the SSH window, use your favorite editor (
nano,vi, etc.) to create a file calledmain.gowritten in Go. For example:nano main.go
- Copy the following into your file:
package main import ( "fmt" "math/rand" "time" ) func main() { // Here's our fake video processing application. Every second, it // checks the length of the input queue (e.g., number of videos // waiting to be processed) and records that information. for { time.Sleep(1 * time.Second) queueSize := getQueueSize() // Record the queue size. fmt.Println("Queue size: ", queueSize) } } func getQueueSize() (int64) { // Fake out a queue size here by returning a random number between // 1 and 100. return rand.Int63n(100) + 1 } - Run the file with:
go run main.go
Defining & recording measures using OpenCensus
- Open your
main.gofile in your text editor:nano main.go
- Add the changes identified by
// [[Add this line]]or// [[Add this block]] … // [[End: add this block]]to your file, then uncomment the added lines and remove the instructions:package main import ( "context" // [[Add this line]] "fmt" "math/rand" "time" "go.opencensus.io/stats" // [[Add this line]] ) // [[Add this block]] var videoServiceInputQueueSize = stats.Int64( "my.videoservice.org/measure/input_queue_size", "Number of videos queued up in the input queue", stats.UnitDimensionless) // [[End: add this block]] func main() { ctx := context.Background() // [[Add: this line.]] // Here’s our fake video processing application. Every second, it // checks the length of the input queue (e.g., number of videos // waiting to be processed) and records that information. for { time.Sleep(1 * time.Second) queueSize := getQueueSize() // Record the queue size. // [[Add: next line.]] stats.Record(ctx, videoServiceInputQueueSize.M(queueSize)) // [[Add]] fmt.Println("Queue size: ", queueSize) } } func getQueueSize()(int64) { // Fake out a queue size here by returning a random number between // 1 and 100. return rand.Int63n(100) + 1 }
Setting up metrics collection & aggregation
Now that the metric is defined and being recorded, the next step is to enable collection and aggregation of the metric. We do this in OpenCensus by setting up a view.
Add the changes identified by // [[Add this line]] or // [[Add this block]] … // [[End: add this block]] to your main.go file, then uncomment the added lines and remove the instructions:
package main
import (
    "context"
    "fmt"
    "log" // [[Add this line]]
    "math/rand"
    "time"
    "go.opencensus.io/stats"
    "go.opencensus.io/stats/view" // [[Add this line]]
)
var videoServiceInputQueueSize = stats.Int64(
    "my.videoservice.org/measure/input_queue_size",
    "Number of videos queued up in the input queue",
    stats.UnitDimensionless)
func main() {
    ctx := context.Background()
    // [[Add this block]]
    // Setup a view so that we can export our metric.
    if err := view.Register( & view.View { // [[Add]]
        Name: "my.videoservice.org/measure/input_queue_size",
        Description: "Number of videos queued up in the input queue",
        Measure: videoServiceInputQueueSize,
        Aggregation: view.LastValue(),
    });err != nil {
        log.Fatalf("Cannot setup view: %v", err)
    }
    // Set the reporting period to be once per second.
    view.SetReportingPeriod(1 * time.Second)
    // [[End: Add this block]]
    // Here’s our fake video processing application. Every second, it
    // checks the length of the input queue (e.g., number of videos
    // waiting to be processed) and records that information.
    for {
        time.Sleep(1 * time.Second)
        queueSize := getQueueSize()
        // Record the queue size.
        stats.Record(ctx, videoServiceInputQueueSize.M(queueSize))
        fmt.Println("Queue size: ", queueSize)
    }
}
func getQueueSize()(int64) {
    // Fake out a queue size here by returning a random number between
    // 1 and 100.
    return rand.Int63n(100) + 1
}
Reporting default metrics to Cloud Monitoring
The final step is to export the application metric to Cloud Monitoring. This is done by configuring the OpenCensus Cloud Monitoring exporter.
Add the changes identified by // [[Add this line]] or // [[Add this block]] … // [[End: add this block]] to your file, then uncomment the added lines and remove the instructions:
package main
import (
    "context"
    "fmt"
    "log"
    "math/rand"
    "os" // [[Add]]
    "time"
    "contrib.go.opencensus.io/exporter/stackdriver" // [[Add]]
    "go.opencensus.io/stats"
    "go.opencensus.io/stats/view"
    monitoredrespb "google.golang.org/genproto/googleapis/api/monitoredres" // [[Add]]
)
var videoServiceInputQueueSize = stats.Int64(
    "my.videoservice.org/measure/input_queue_size",
    "Number of videos queued up in the input queue",
    stats.UnitDimensionless)
func main() {
    // [[Add block]]
    // Setup metrics exporting to Stackdriver.
    exporter, err := stackdriver.NewExporter(stackdriver.Options {
        ProjectID: os.Getenv("MY_PROJECT_ID"),
        Resource: & monitoredrespb.MonitoredResource {
            Type: "gce_instance",
            Labels: map[string] string {
                "instance_id": os.Getenv("MY_GCE_INSTANCE_ID"),
                "zone": os.Getenv("MY_GCE_INSTANCE_ZONE"),
            },
        },
    })
    if err != nil {
        log.Fatalf("Cannot setup Stackdriver exporter: %v", err)
    }
    view.RegisterExporter(exporter)
        // [[End: add block]]
    ctx := context.Background()
    // Setup a view so that we can export our metric.
    if err := view.Register( & view.View {
        Name: "my.videoservice.org/measure/input_queue_size",
        Description: "Number of videos queued up in the input queue",
        Measure: videoServiceInputQueueSize,
        Aggregation: view.LastValue(),
    });
    err != nil {
            log.Fatalf("Cannot setup view: %v", err)
        }
        // Set the reporting period to be once per second.
    view.SetReportingPeriod(1 * time.Second)
    // Here’s our fake video processing application. Every second, it
    // checks the length of the input queue (e.g., number of videos
    // waiting to be processed) and records that information.
    for {
        time.Sleep(1 * time.Second)
        queueSize := getQueueSize()
        // Record the queue size.
        stats.Record(ctx, videoServiceInputQueueSize.M(queueSize))
        fmt.Println("Queue size: ", queueSize)
    }
}
func getQueueSize()(int64) {
    // Fake out a queue size here by returning a random number between
    // 1 and 100.
    return rand.Int63n(100) + 1
}
View your application metrics in Cloud Monitoring
In the SSH window, set the necessary environment variables:
- Project ID – found on the page where you started this lab.
export MY_PROJECT_ID=<your-project-id>
export MY_GCE_INSTANCE_ID=my-opencensus-demo
export MY_GCE_INSTANCE_ZONE=us-west1-b
go mod tidy
- Now run your application:
go run main.go
- You can leave the application running.
- Go back to the Cloud Console, you should be on the Cloud Monitoring window.
- In the left menu, click Metrics Explorer.
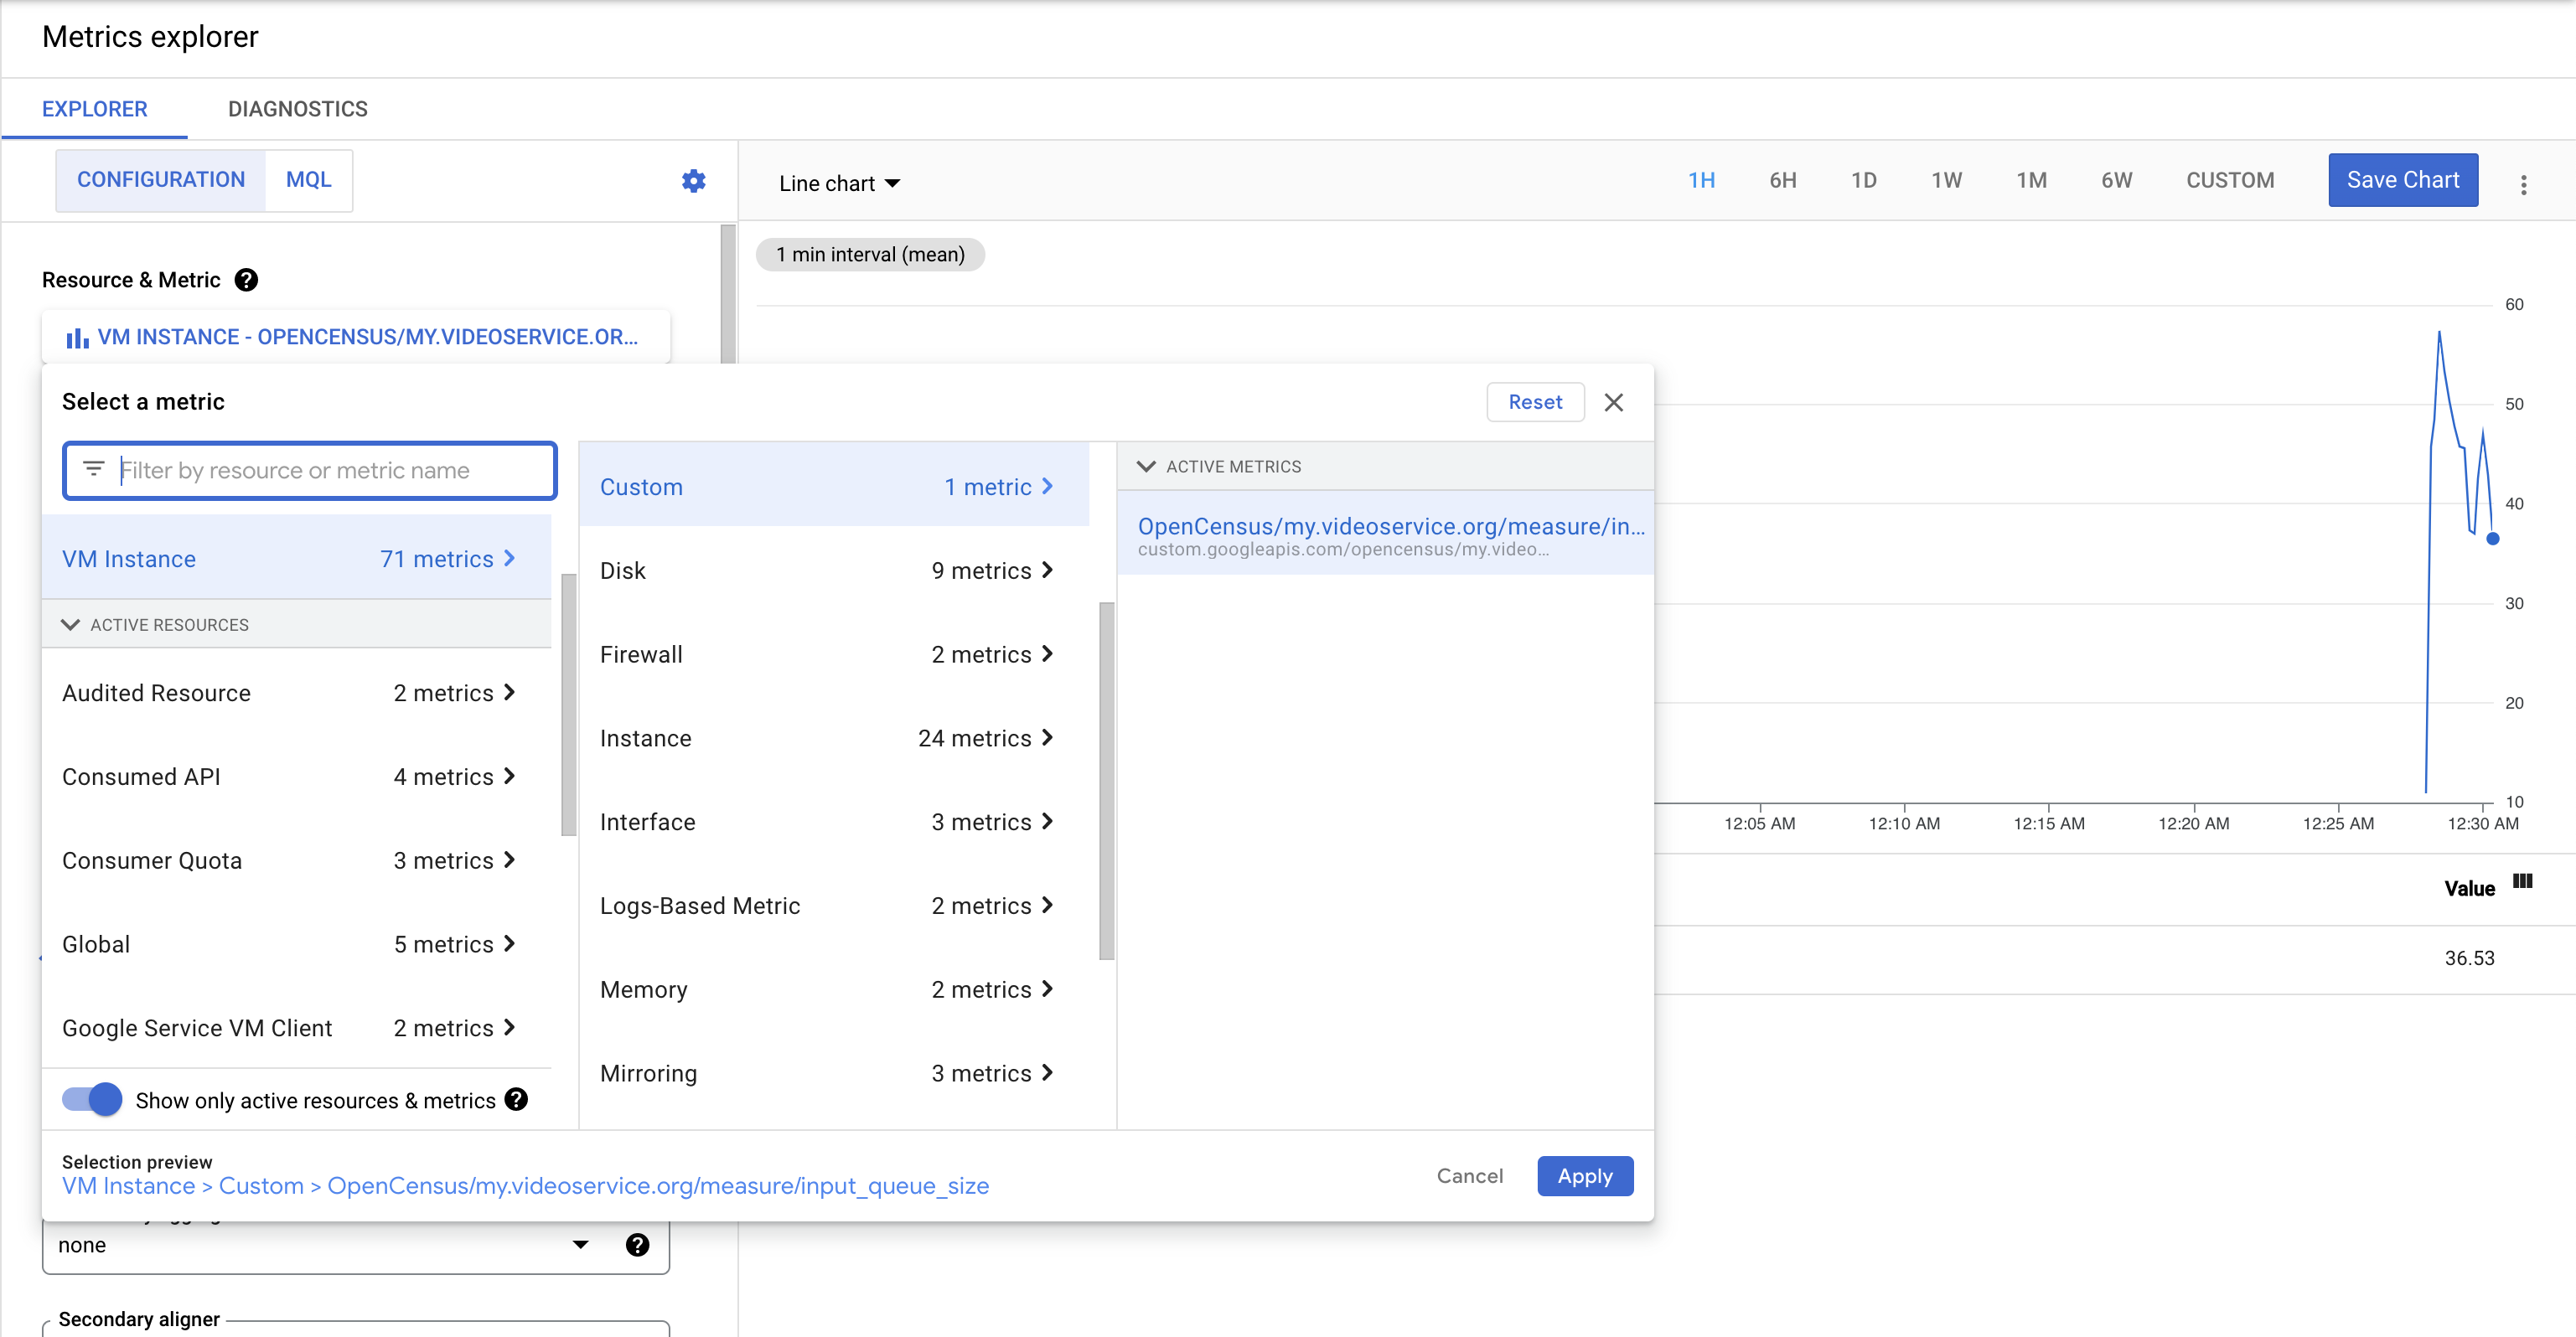
- Start typing
inputinto the Select a Metric dropdown, and then select VM Instance > Custom and select OpenCensus/my.videoservice.org from the suggested metrics and click Apply.

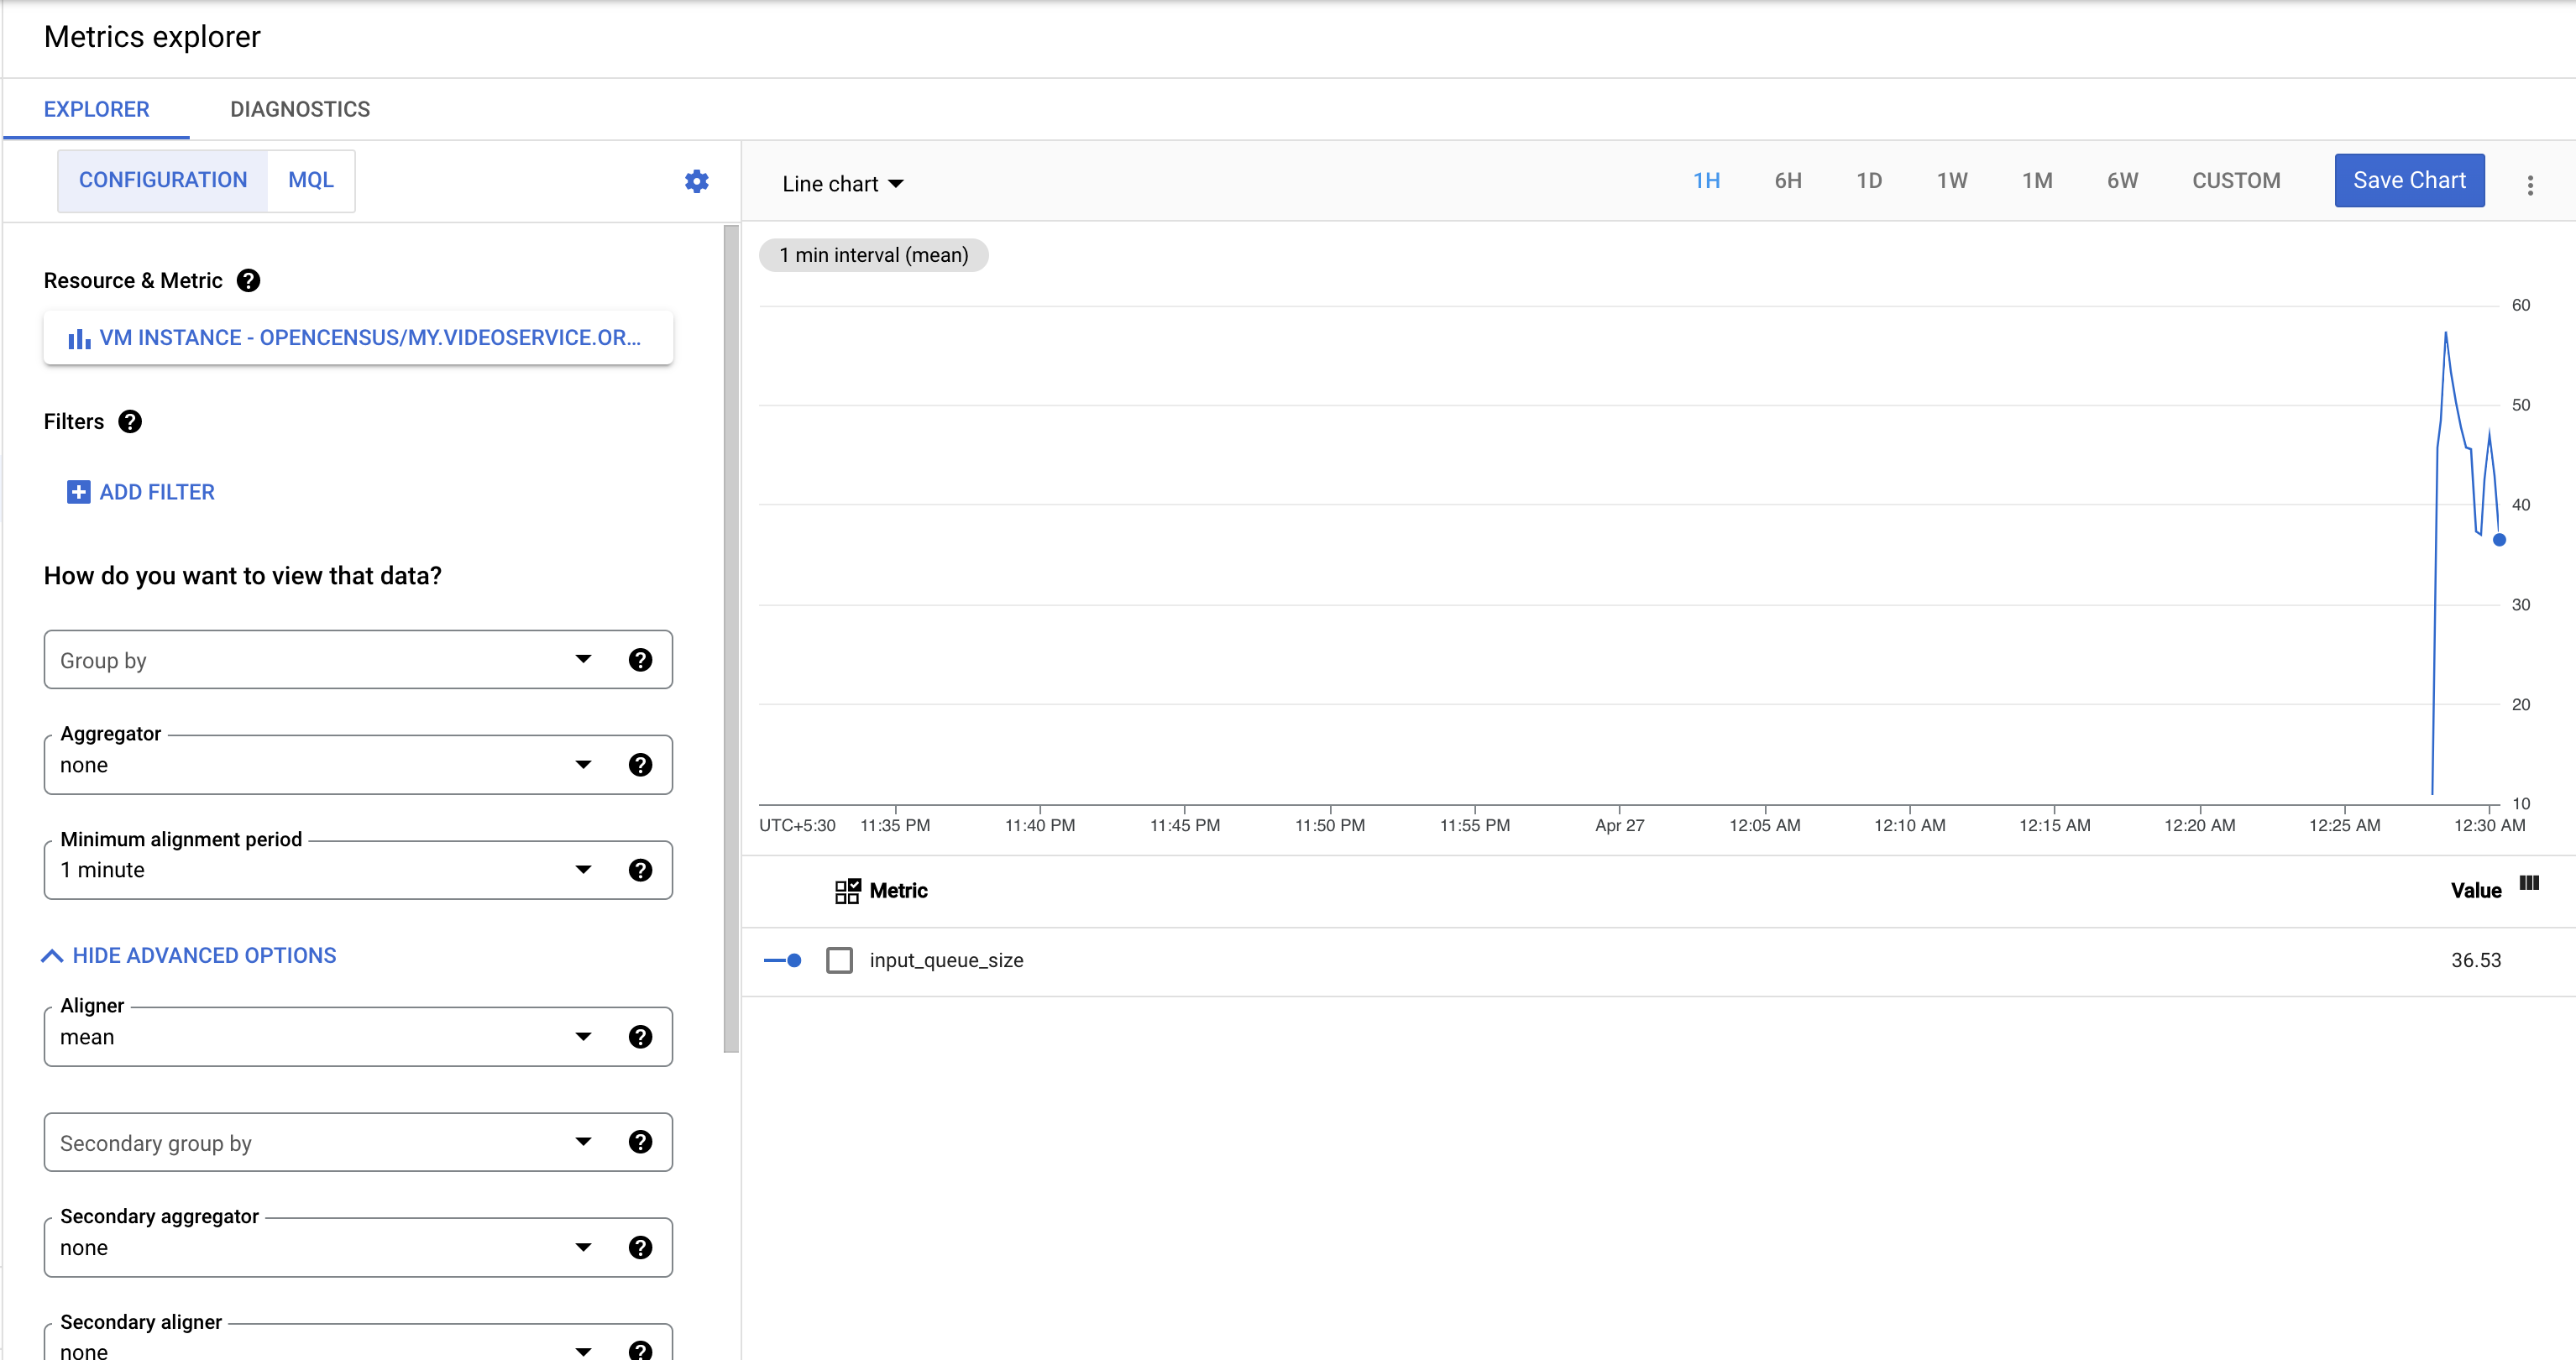
You should soon see data in the graph, maybe something like this:

Tag:Google Cloud
