VPC Flow Logs – Analyzing Network Traffic
Configure a custom network with VPC Flow Logs
Create the custom network
- In the Console, navigate to Navigation menu > VPC network > VPC networks.

- Click Create VPC Network.
- Set the following values, leave all others at their defaults:
Name: vpc-net
Description: Enter an optional description - For Subnet creation mode, click Custom.
- Set the following values, leave all others at their defaults:
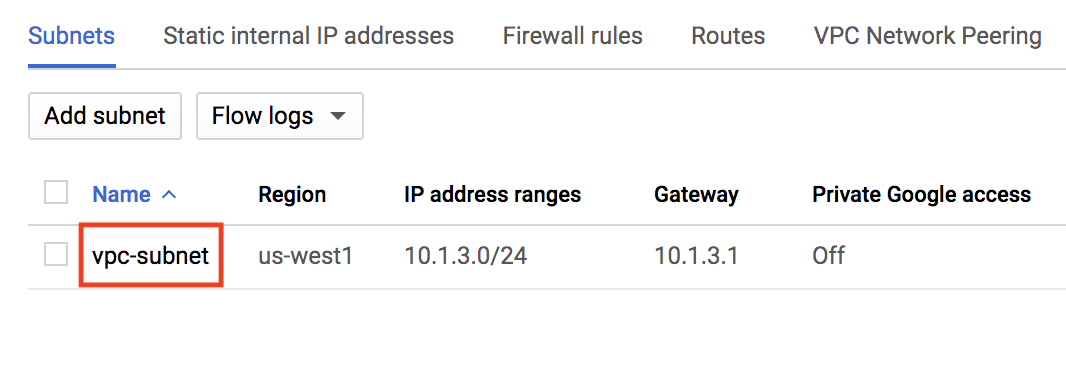
Name: vpc-subnet
Region: us-west1
IP address range: 10.1.3.0/24
Flow Logs: On - Click Done, and then click Create.
Create the firewall rule
- In the left menu, click Firewall.
- Click Create Firewall Rule.
- Set the following values, leave all others at their defaults:
Name: allow-http-ssh
Network: vpc-net
Targets: Specified target tags
Target tags: http-server
Source filter: IPv4 ranges
Source IP ranges: 0.0.0.0/0
Protocols and ports: Specified protocols and ports, and then check tcp, type: 80, 22 - Click Create.
Create an Apache web server
Create the web server
- In the Console, navigate to Navigation menu > Compute Engine > VM instances.
- Click CREATE INSTANCE.
- Set the following values, leave all others at their defaults:
Name: web-server
Region: us-west1
Zone: us-west1-b
Machine type: f1-micro (1 vCPU, 614 MB memory)
Firewall: Allow HTTP traffic - Click Management, security, disks, networking, sole tenancy.
- Click Networking.
- For Network interfaces, click on
defaultto edit. - Set the following values, leave all others at their defaults:
Network: vpc-net
Subnetwork: vpc-subnet - Click Done, and then click Create.
Install Apache
- Return to the Console, still on the VM instances page (Navigation menu > Compute Engine > VM instances). For web-server, click SSH to launch a terminal and connect.
- In the web-server SSH terminal, update the package index:
sudo apt-get update
- Install the Apache2 package:
sudo apt-get install apache2 -y
- Create a new default web page by overwriting the default:
echo '<!doctype html><html><body><h1>Hello World!</h1></body></html>' | sudo tee /var/www/html/index.html
- Exit the SSH terminal:
exit
Verify that network traffic is logged
Generate network traffic
- Return to the Console, still on the VM instances page (Navigation menu > Compute Engine > VM instances).
- To view web-server, click the External IP to access the server.
Find your IP address
- Click this whatismyip.host to find your IP v4 address.
- Copy your IP address. It will be referred to as
YOUR_IP_ADDRESS.
Access the VPC Flow Logs
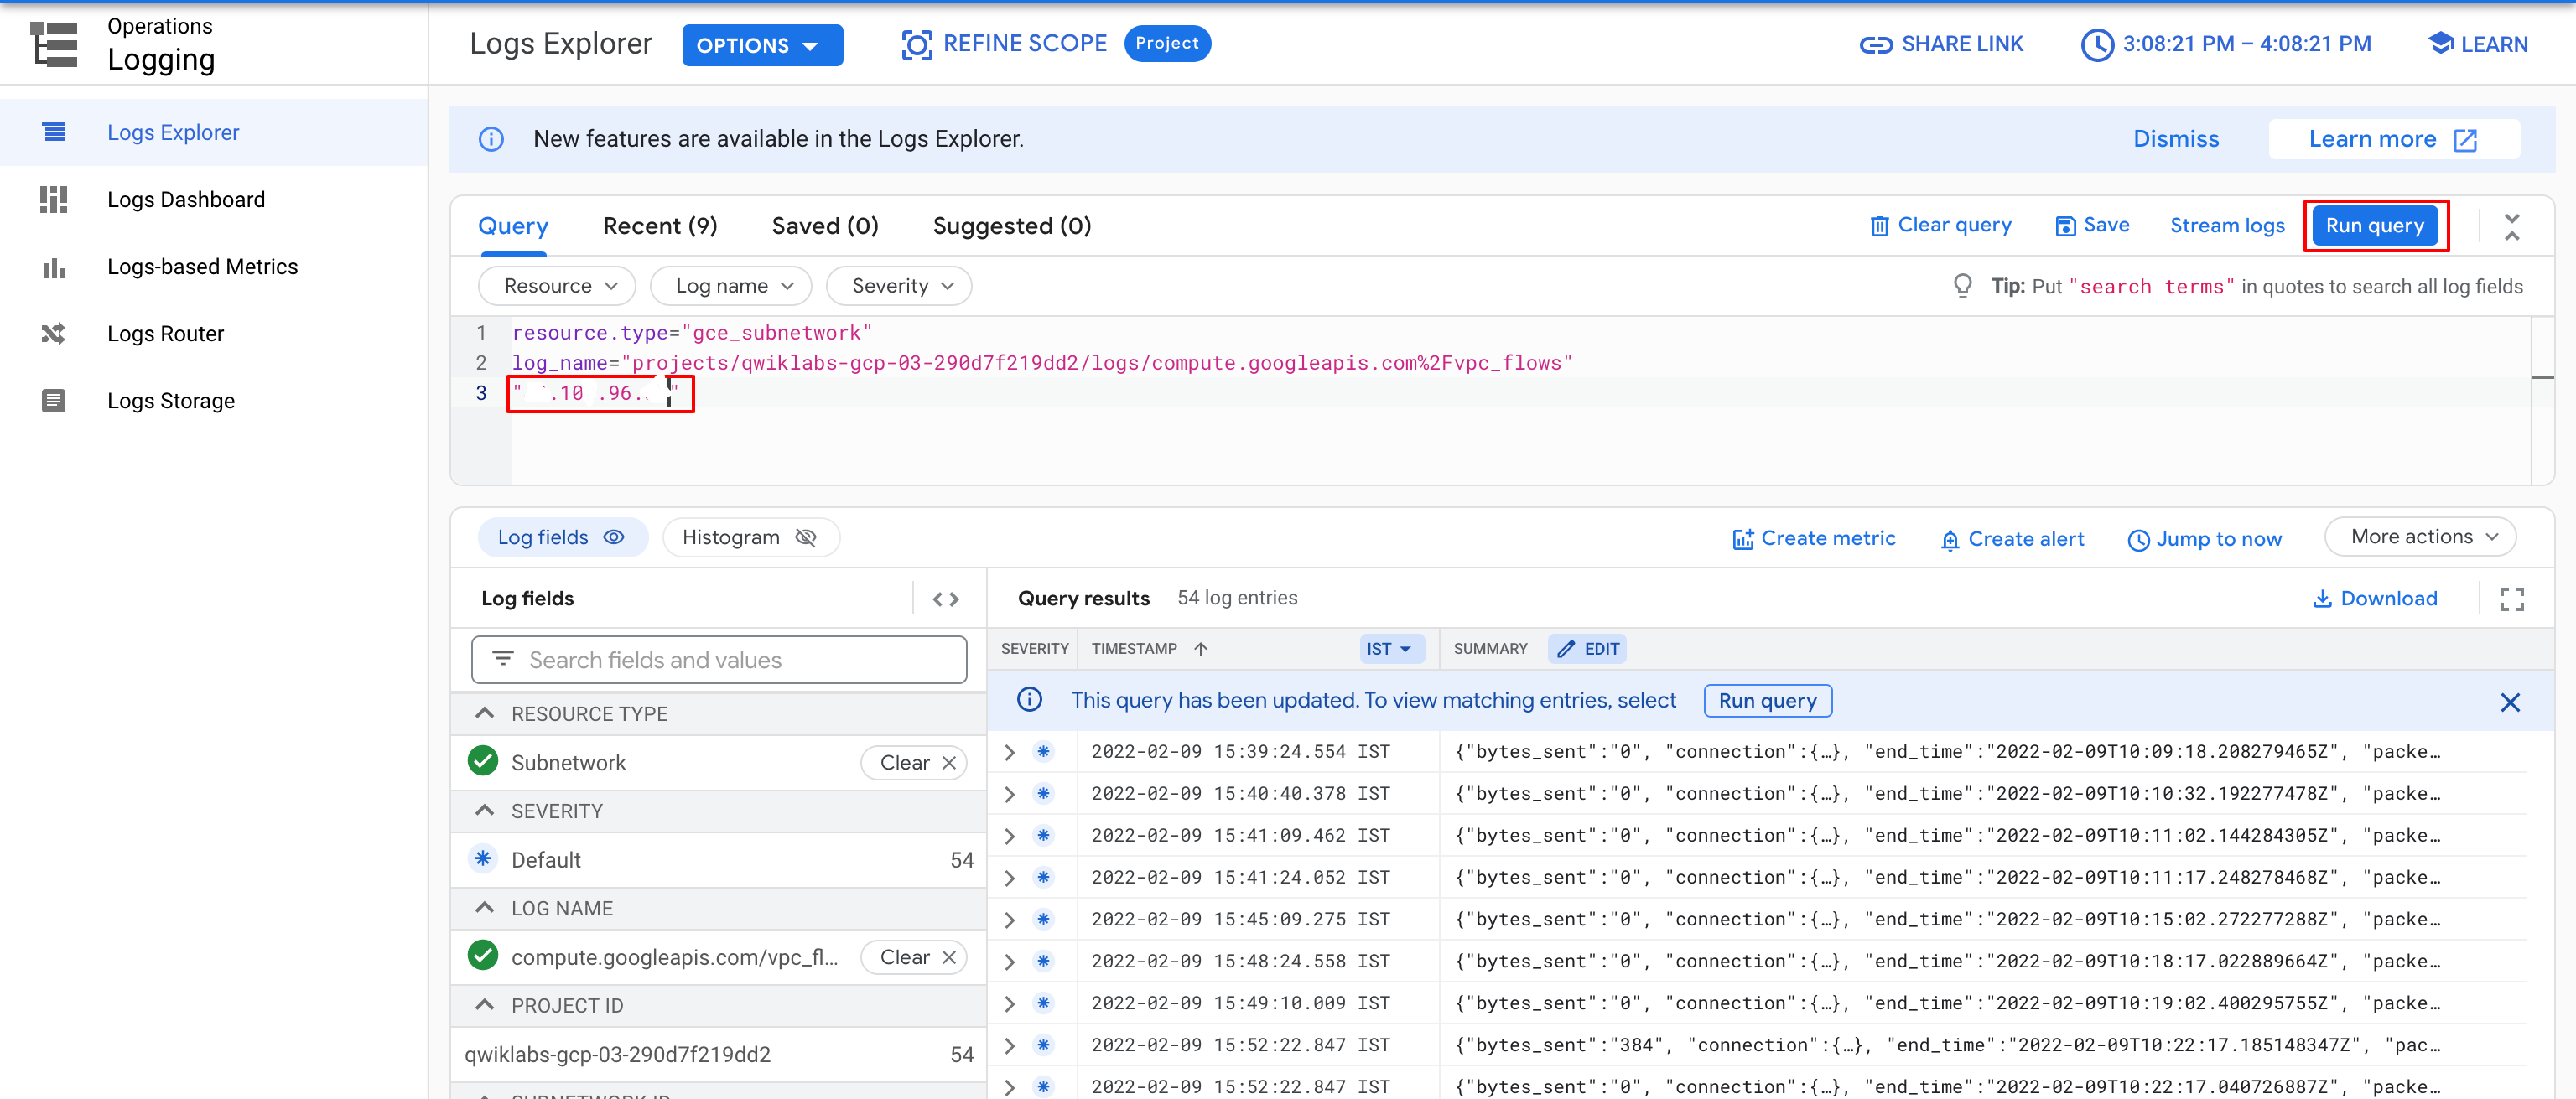
- In the Console, navigate to Navigation menu > Logging > Logs Explorer.
- In the Log fields panel, under Resource, click Subnetwork. In the Query results pane, entries from the subnetwork logs appear.
- In the Log fields panel, under Log name, click compute.googleapis.com/vpc_flows.
- Enter
"YOUR_IP_ADDRESS"in the Query search box at the top. Then Click Run Query.

- Click on one of the log entries to expand it.
- Within the entry, click the arrows to expand the jsonPayload and then the connection. You may have to click Expand all to see the connection.

Export the network traffic to BigQuery to further analyze the logs
Create an export sink
- In the Console, in the left pane, click Logs Explorer.
- From Resources dropdown, select Subnetwork. Then click Add.
- From Log name dropdown, check vpc_flows and click Add. Then, click Run query.
- Click More Actions > Create Sink.
- For “Sink Name”, type vpc-flows and click NEXT.
- For “Select sink service”, select the BigQuery dataset.
- For “Sink Destination”, select Create new BigQuery dataset.
- For “Dataset ID”, type bq_vpcflows, and then click CREATE DATASET.
- Click CREATE SINK. The Logs Router Sinks page appears. You should be able to see the sink you created (vpc-flows). If you are unable to see the sink click on Logs Router.
Generate log traffic for BigQuery
- In the Console, navigate to Navigation menu > Compute Engine > VM instances.
- Note the External IP address for the web-server instance to use in the next step. It will be referred to as
EXTERNAL_IP. - In the Cloud Shell command line, run the following command to store the
EXTERNAL_IPin an environment variable. Replace the <EXTERNAL_IP> with the address you just noted.export MY_SERVER=<EXTERNAL_IP>
- Access the web-server 50 times from Cloud Shell:
for ((i=1;i<=50;i++)); do curl $MY_SERVER; done
Visualize the VPC Flow Logs in BigQuery
- In the Console, navigate to Navigation menu (
) > BigQuery.
- If prompted, re-enter the Qwiklabs-provided student password and click Sign in.
- On the left-hand side, expand the bq_vpcflows dataset to reveal the table. You might have to first expand the Project ID to reveal the dataset.
- Click on the name of the table. It should start with compute_googleapis.
- Click on Details tab.
- Copy the portion of the Table ID that is after the colon(:). It will be referred to as
TABLE_ID. - Add the following to the Query Editor and replace your_table_id with
TABLE_IDwhile leaving the accents (`) on both sides:#standardSQL SELECT jsonPayload.src_vpc.vpc_name, SUM(CAST(jsonPayload.bytes_sent AS INT64)) AS bytes, jsonPayload.src_vpc.subnetwork_name, jsonPayload.connection.src_ip, jsonPayload.connection.src_port, jsonPayload.connection.dest_ip, jsonPayload.connection.dest_port, jsonPayload.connection.protocol FROM `your_table_id` GROUP BY jsonPayload.src_vpc.vpc_name, jsonPayload.src_vpc.subnetwork_name, jsonPayload.connection.src_ip, jsonPayload.connection.src_port, jsonPayload.connection.dest_ip, jsonPayload.connection.dest_port, jsonPayload.connection.protocol ORDER BY bytes DESC LIMIT 15
- Click Run.
Analyze the VPC Flow Logs in BigQuery
- Create a new query in the Query Editor with the following and replace your_table_id with
TABLE_IDwhile leaving the accents (`) on both sides:#standardSQL SELECT jsonPayload.connection.src_ip, jsonPayload.connection.dest_ip, SUM(CAST(jsonPayload.bytes_sent AS INT64)) AS bytes, jsonPayload.connection.dest_port, jsonPayload.connection.protocol FROM `your_table_id` WHERE jsonPayload.reporter = 'DEST' GROUP BY jsonPayload.connection.src_ip, jsonPayload.connection.dest_ip, jsonPayload.connection.dest_port, jsonPayload.connection.protocol ORDER BY bytes DESC LIMIT 15
- Click Run.
Add VPC Flow Log aggregation
Setting up aggregation
- In the Console, navigate to Navigation menu > VPC network > VPC networks.
- Click vpc-net, and then click Edit.
- In the Subnets tab, click vpc-subnet:

- Click Edit > Configure logs to expose the following fields:

- Set the Aggregation Interval to 30 seconds.
- Set the Sample rate to 25%.
- Click Save. You should see the following message:
Tag:Google Cloud
